采购费用报告
通过*采购*应用程序,用户可以监控一段时间内的采购支出。该报告可帮助企业追踪和分析支出情况,确定节约成本的机会,并确保高效的预算管理。
创建采购费用报告
要创建 procurement expenses report,首先导航至 打开 采购分析 仪表板。
默认情况下,仪表板会显示一个折线图,概览了本月:guilabel:采购订单(PO)`的:guilabel:`不含税总额,该数据基于订单的 确认日期。或者,如果没有采购订单数据,则会显示报价请求(RFQ)的状态为*草稿*、*已发送*或*已取消*的概览。
添加筛选器和分组
点击右上角的 (枢轴) 图标切换到透视图。
小技巧
While the procurement expenses report can also be viewed as a (bar chart), (line chart), or (pie chart), the pivot view provides the most detailed view of the data, and is the recommended starting point.
Remove any default filters from the Search… bar. Then, click the (down) icon to open the drop-down menu that contains the Filters, Group By, and Favorites columns.
注解
Unless otherwise specified, the report displays data from both RfQs and POs. This can be changed by selecting either Requests for Quotation or Purchase Orders under the Filters column.
Under the Filters column, select a time frame to use for comparison. The report can be filtered by either Order Date or Confirmation Date. Choose one from the list, and click the (down) icon to specify the date range, either by month, quarter, or year.
Next, under the Group by column, select Vendor. Then, select Product Category, which is also located in the Group By column.
注解
The selections under the Group By heading can be altered, depending on the needs of the individual company. For example, selecting Product, instead of Product Category, provides a more in depth look at the performance of specific items, in place of an entire category.
Next, make a selection under the Comparison heading that appears. These options are only available after the date range is selected under the Filters column, and vary based on that range. Previous Period adds a comparison to the previous period, such as the last month or quarter. Previous Year compares the same time period from the previous year.
注解
While multiple time-based filters can be added at once, only one comparison can be selected at a time.
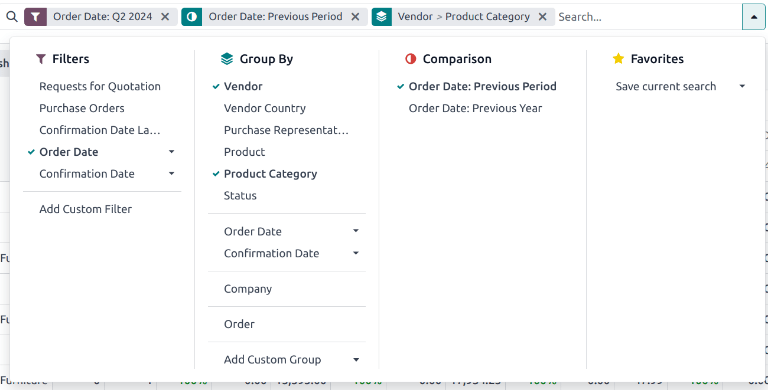
The filter for Q2, comparison for Previous Period, and group-by for Vendor and Product Category were selected.
增加措施
选择 筛选器,分组方式 和 比较 设置后,点击下拉菜单。
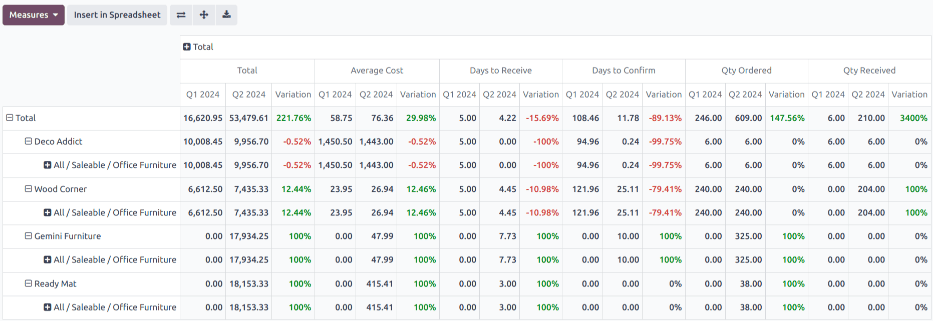
默认情况下,报告显示以下度量数据:订单、总计、未达标总计 和:guilabel:数量。点击左上角的 度量 打开可用措施的下拉列表。
点击以下具体措施,为采购支出报告添加其他列:
总计 和 未税总计:可包括一个或两个指标。这些措施用于总体支出分析。
平均成本:用于评估成本效率。
确认天数 和 接收天数:用于评估供应商绩效。
订购数量 和 收到数量:用于了解订单效率。
计费数量 和 待计费数量:用于追踪订单的准确性。
小技巧
如果需要,还可以在报告中加入其他指标,以提供更多见解。例如,毛重 和:guilabel:体积 可用于进一步的物流和管理分析。
选择所有必要措施后,点击退出下拉菜单。
查看结果
选择所有筛选器和度量值后,报告就会在所选视图中生成。
点击 插入电子表格 将透视视图添加到 文件 应用程序中的可编辑电子表格格式中。
重要
只有安装了 文件电子表格 模块,才能使用 插入电子表格 选项。
注解
在图表视图中也可以使用 procurement expenses report。点击 (区域图) 图标切换到图表视图。点击报告顶部的相应图标,切换到:icon:fa-bar-chart (条形图)、 (折线图)`或:icon:`fa-pie-chart (饼状图)。
参见
要将此报告保存为*收藏*,请参阅 收藏夹。